Numbers Behind Tech Job Layoffs Due to COVID-19
Following my previous 20% Project that analyzed AirBnB’s latest round of layoffs, in this latest installment I explored the bigger tech industry layoffs across America. Torch Capital, a NY-based venture capital, created Torch Capital Talent Connect database for tech workers that are laid off due to the pandemic to explore new opportunities. I scraped the information of job seekers who are listed in the databased to learn more about the details of tech job layoffs.
import time
import requests
import os
import requests

import re
import numpy as np
import pandas as pd
import seaborn as sns
import matplotlib.pyplot as plt
from wordcloud import WordCloud
import datetime
import matplotlib.dates as mdates

# for scraping javascript rendered webpages
from selenium import webdriver
from selenium.webdriver.common.keys import Keys
from bs4 import BeautifulSoup as bs

#<!-- from plotly import __version__ -->
#<!-- from plotly.offline import download_plotlyjs, init_notebook_mode, plot, iplot -->
#<!-- import plotly.graph_objects as go -->
#<!-- init_notebook_mode(connected=False) -->

%matplotlib inline
sns.set_style('whitegrid')
plt.rcParams.update({'font.size':14})
Scrape data
First, start by creating a TorchConnectScraper class object to scrape the data. Analysis will come afterwards.
class TorchConnectScraper:
    def __init__(self):
        self.profile_list = []


    def open_browser(self, url):
        # initialize headless Chrome browser
        self.driver = webdriver.Chrome(executable_path=os.path.abspath('')+'/chromedriver')
        self.driver.get(url)
        time.sleep(3)


    def get_seekers(self):
        next_page = True
        while next_page:
            # get page HTML
            page_html = self.driver.page_source
            bsoup = bs(page_html, 'html.parser')
            # get profiles
            profiles = bsoup.find_all('tr',
                                      attrs={'class':'MuiTableRow-root',
                                             'role':'row'})
            # parse and append to profile list
            for profile in profiles:
                self.profile_list.append(self.clean_profile(profile))
            # move onto next page
            try:
                self.driver.find_element_by_xpath("//button[@title='Next page']/span").click()
                time.sleep(1)
            except webdriver.remote.errorhandler.ElementClickInterceptedException:
                next_page = False

        self.df = pd.DataFrame(self.profile_list,
                  columns=['add_date', 'name', 'company',
                           'sector', 'title', 'city', 'relocate'])


    def get_city(series):
        """not used"""
        processed = (series.str.split(r',', expand=True)
                     .drop(columns=[1,2])
                     .iloc[:,0].str.lower()
                     .replace(r'washington\s?.*', 'washington d.c.', regex=True)
                     .replace(r'.*(san francisco|sf).*', 'san francisco', regex=True)
                     .replace(r'.*(new york|nyc|ny|newyork).*', 'new york', regex=True)
                     .replace(r'.*remote.*', 'remote', regex=True)
                     .str.strip()
                     .str.title()
                     .to_frame().rename(columns={0:'city'})
                    )
        return processed


    def clean_profile(self, res):
        add_date = res.contents[0].text
        name = res.contents[1].text
        company = res.contents[2].text
        sector = self.clean_sector(res.contents[3].text)
        title = res.contents[4].text
        city = self.clean_city(res.contents[5].text)
        relocate = res.contents[6].text
    #     linkedin = res.contents[7].text
    #     email = res.contents[8].text
        return [add_date, name, company, sector, title, city, relocate]


    @staticmethod
    def clean_city(txt):
        new = re.split(r',', txt)[0].lower()
        new = re.sub(r'washington\s?.*', 'washington d.c.', new)
        new = re.sub(r'.*(san francisco|sf).*', 'san francisco', new)
        new = re.sub(r'.*(new york|nyc|ny|newyork).*', 'new york', new)
        new = re.sub(r'.*(boston).*', 'boston', new)
        new = re.sub(r'.*remote.*', 'remote', new).strip().title()
        return new


    @staticmethod
    def clean_sector(txt):
        new = txt.strip()
        new = re.sub('', 'Unknown', new) if not new else new
        return new


    def close_browser(self):
        self.driver.quit()
# Scrape data from website
url = 'https://talentconnect.torchcapital.vc/browse/talent'
scraper = TorchConnectScraper()
scraper.open_browser(url)
scraper.get_seekers()
scraper.close_browser()
EDA
df = scraper.df
df = (df.assign(date = lambda x: pd.to_datetime(x.add_date)))
latest = df.date.dt.strftime("%Y/%m/%d").values[0]
print(f"Number of job seekers: {df.shape[0]:,} (as of {latest})")
df.head(2)
Number of job seekers: 1,185 (as of 2020/05/25)
| add_date | name | company | sector | title | city | relocate | date | |
|---|---|---|---|---|---|---|---|---|
| 0 | 05/25/2020 | Shahnaz Moz | EPIC Semiconductors | BD/Sales/Marketing | Marketing Director | Vancouver | yes | 2020-05-25 |
| 1 | 05/24/2020 | Lydia Chim | University of Southern California | Finance/Ops/Analytics | Student | Los Angeles | yes | 2020-05-24 |
Let’s check the distribution layoffs by the tech sectors.
sectors = df.groupby('sector').name.count().to_frame().reset_index()
sectors = sectors.rename(columns={'name':'counts'})
sectors['pct'] = sectors.counts.transform(lambda x: x/x.sum() * 100)

p = sns.barplot(x=sectors.pct, y=sectors.sector, orient='h');
plt.xlabel('Percent of Total (%)')
plt.ylabel('Sector');
p.set_frame_on(False)

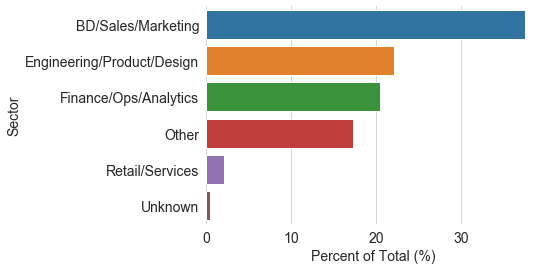
~40% of the layoffs are in the areas of business development, sales, and marketing. This differs from AirBnB’s case, which laid off mostly workers in customer service, recruiting, and design. I think this strategy makes business sense, since in times of uncertainty companies will want to set stricter priorities and reduce spending by cutting expandable costs around new investments and advertisement. Engineering, product, design, and other roles associated with products comprise ~22% of the layoffs. Even though products are an essential part of any tech company, sadly those who are involved in actually making the products are not spared in times of crisis. The reality is that resource-strapped tech companies need to curtail innovation and conserve resources in order to survive the downturn. Finance/Ops/analytics comes in 3rd with ~20% of the total layoffs. These performs any company’s core functions by bringing in revenue, so it makes sense to see that they’re more resilient to layoffs. I wonder if this difference in sector layoffs applies to non-tech industry as well.
Next, let’s qualitatively check the types of positions that are laid off with a word cloud.
# Generate Text for Wordcloud
titles = df.title.str.lower().replace(r'[\(\)/\|\\&+,]', ' ', regex=True)
text= ""
for value in titles:
    text += value + ' '

wordcloud = WordCloud(width=1200, height=630,
                      max_font_size=200, collocations=False,
#                       color_func=lambda *args, **kwargs: (255,0,0),
                      colormap='Blues', background_color='white').generate(text)

plt.figure(figsize=(15,15))
plt.imshow(wordcloud, interpolation="bilinear")
plt.axis("off")
plt.show()

Looks like a lot of senior personnel with director, manager, and marketing titles have been laid off, most likely from sales/BD/marketing. In times of crisis even people with seniority are not immune to job insecurity. I would bet this kind of economic downturn also gives companies a good reason to “restructure” by weeding out unproductive workers who have worked their way through the ranks by staying in the company. This brings up another harsh reality of the capitalistic society we live in: no one is truly indispensable to a company. The layoff pool also have a lot of engineers, operations, product, and analysts people, which constitute the production side of the company.
Since we also have the dates of individual listings, we can see how the number of job seekers in each sector changed over time.
total = df.groupby('date').name.count().to_frame()
total = total.rename(columns={'name':'counts'})
total = total.reset_index()
ndays = len(total.date.unique())
mapping = {a:b for a,b in zip(total.date.values, range(ndays))}
total['total'] = total.counts.cumsum()
total['date_'] = total.date.map(mapping)


day_by_sec = df.groupby(['date', 'sector']).name.count().to_frame()
day_by_sec = day_by_sec.rename(columns={'name':'counts'})
day_by_sec = day_by_sec.reset_index()
day_by_sec['date_'] = day_by_sec.date.map(mapping)
# scatter plot
fig0 = plt.figure(1, figsize=(15,8), tight_layout=True)
ax0 = fig0.gca()
ax1 = ax0.twinx()

sns.scatterplot(y=day_by_sec.counts, x=day_by_sec.date_,
                style=day_by_sec.sector, s=150,
                hue=day_by_sec.sector, alpha=0.7,
                palette=sns.color_palette('hls', n_colors=6),
                ax=ax0
               );

# bar plot
sns.barplot(x=total.date_, y=total.total,
            alpha=0.2, ax=ax1
           );

ax1.grid(False)
ax0.yaxis.grid(False)
ax0.set_xticks(range(1, ndays, 7))
ax0.set_xticklabels(total.date.dt.strftime('%a, %b %d').values[range(1, ndays, 7)])
ax0.set_ylabel('Num. Seekers by Sector')
ax0.set_xlabel('Date')
ax0.tick_params(axis=u'both', which=u'both', length=0)
ax0.legend(frameon=False, loc='right', markerscale=1.5)
ax0.set_frame_on(False)
ax1.set_ylabel('Cumulative Sum')
ax1.set(ylim=[200, 1200])
ax1.tick_params(axis=u'both', which=u'both', length=0)
ax1.set_frame_on(False)

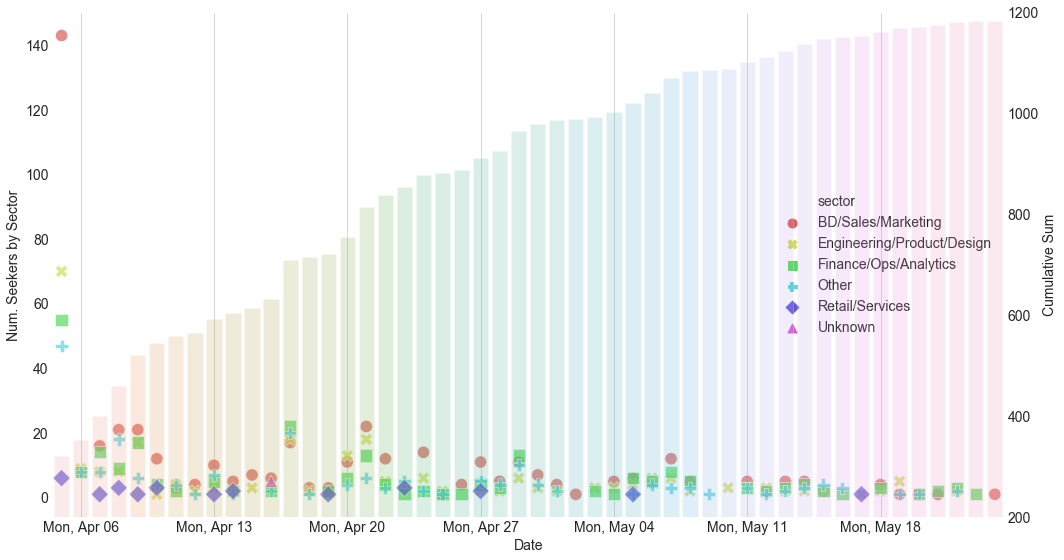
This time-dependent plot is interesting and deserves close study. On the first day the website was up (Apr. 5th) over 300 people shared their information on the website, with BD/Sales/Marketing making most of the pool. Then over the next 3 weeks there were varying influxes of new job seekers from different sectors that posted to the board. The total numbers added each day during those 3 weeks varied considerably from weekday to weekday, reflecting a few weeks of tumultuous scramble as companies rush to figure out a strategy for dealing with the economic downturn. We even see a big increase on Apr 17. Let’s see what that’s about.
df[df.date == '2020-04-17'].company.value_counts()[:5]
Opendoor                                      64
Clarify Health Solutions                       2
International Institute of Tourism Studies     2
Harvard Graduate School of Education           1
Avery Dennison                                 1
Name: company, dtype: int64
Opendoor is a SF-based real estate startup that laid off 600 of its employees (35% of its overall team) on April 15th. This explains the spike in new job seekers on the board on April 17th. Just out of curiosity, below are the 5 companies with the most layoffs on the job board.
df.groupby('company').name.count().sort_values(ascending=False)[:5]
company
Opendoor        64
Wonderschool    32
Loftsmart       26
Lola            16
                12
Name: name, dtype: int64
After 3 weeks, the number of new job seekers on Torch Connect decreased, and now the board averages less than 5 new additions per day. Lastly, let’s swtich up and check what cities those seekers are in.
city = (df.city.value_counts()
         .to_frame()
         .reset_index()
         .rename(columns={'city':'counts', 'index':'city'})
        )
city['pct'] = city.counts.transform(lambda x: x/x.sum() * 100)

p = sns.barplot(x=city.pct[:10], y=city.city[:10], orient='h');
plt.xlabel('Percent of Total (%)')
plt.ylabel('City');
p.set_frame_on(False)

Let’s also show a map with the numbers.
# get city coordinates
url = url = 'https://public.opendatasoft.com/api/records/1.0/search/?'
params = {'dataset':'1000-largest-us-cities-by-population-with-geographic-coordinates',
          'facet':['state', 'city'],
          'sort':'-rank', 'rows':500}
r = requests.get(url, params=params)
# get new data frame with all data
states = pd.json_normalize(r.json()['records'])
states = (states.drop(columns=['datasetid', 'recordid', 'record_timestamp',
                               'geometry.type', 'fields.growth_from_2000_to_2013'])
          .rename(columns={'fields.city':'city', 'fields.state':'state',
                           'fields.rank':'rank', 'fields.growth_from_2000_to_2013':'growth',
                           'fields.population':'pop', 'fields.coordinates':'coordinates',
                           'geometry.coordinates':'geo_coords'})
         )
states[['lat', 'lon']] = pd.DataFrame(states.coordinates.tolist(), index=states.index)
states.drop(columns=['coordinates'], inplace=True)
# states.head()

cities = pd.merge(left=city, right=states, left_on='city', right_on='city', how='left')
cities['text'] = cities.city + ', ' + cities.state
# cities.head()
# plot the map
fig = go.Figure()
limits = [(0,5), (6,10), (11,20), (21,50), (51, 1000)]
colors = ["royalblue", "crimson", "lightseagreen", "orange", "lightgrey"]

scale=0.1
for i in range(len(limits)):
    lim = limits[i]
    sdf = cities[(cities.counts > lim[0]) & (cities.counts < lim[1])]
    fig.add_trace(go.Scattergeo(
        locationmode = 'USA-states',
        lon = sdf['lon'],
        lat = sdf['lat'],
        marker = dict(
            size = sdf['counts']/scale,
            line_color='rgb(40,40,40)',
            line_width=0.5,
            opacity=0.5,
            sizemode = 'area'),
    customdata=sdf[['text','counts', 'pop', 'pct']],
    hovertemplate='<b>%{customdata[0]}</b><br># job seekers: %{customdata[1]:,}<br>Population: %{customdata[2]:,}<br>Pct total: %{customdata[3]:.1f}%',
    name = '{0} - {1}'.format(lim[0], lim[1])))

fig.update_layout(
        title_text = 'Job Seekers Across America<br>(Click legend to toggle traces)',
        showlegend = True,
        geo = dict(
            scope = 'usa',
            landcolor = 'rgb(217, 217, 217)',
        )
    )

fig.show()
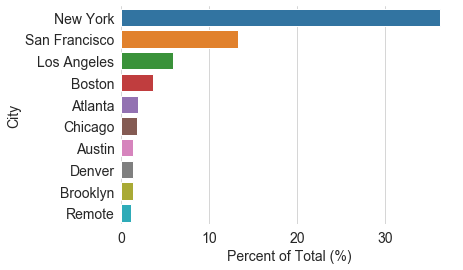
About 1/3 of the job seekers are located in NY, probably because Torch Capital has more opportunity to promote this database there. SF and LA make up another 20%. There are also many job seekers from cities across the world, such as Hyderabad, Bristol, and Copenhagen, that I didn’t include in the map here.
Conclusion
And there you have it. In this short project I explored a database of tech industry job seekers that have recently been laid off due to the Coronavirus pandemic. A large portion of the pool are in the business development, marketing and sales sector, in which there are a significant number of individuals with mid to senior level titles such as “director” and “manager”. Engineers, designers and programmers are also not spared in the layoffs. Lastly, I visualized the spread of job seekers across the states and found that ~50% are from the major tech hubs of NY, SF and LA, and a decent amount are coming from smaller cities such as Boston, Atlanta, Chicago, Denver, Phoenix, and Austin.
To wrap up, I want to point out that behind those numbers are individual stories of pain and disappointment caused by the economic crisis. I don’t want to dehumanize them by treating them as just another number, but I think this kind of analysis can be somewhat comforting in showing that no matter how bleak the job market looks in the foreseeable future, many tech workers in America are experiencing this “interesting” time together.