The Numbers Behind AirBnB's Recent Layoffs
The negative impact brought on by the Coronavirus pandemic is finally hitting the tech industry, as major tech companies begin laying off employees in droves in anticipation of the prolonged economic downturn. I want to understand the demographic of those in the tech industry that are impacted by this crisis, so I analyzed the profiles of AirBnB employees from their recently published AirBnB talent pool. In the post I’ll also explain the codes I used to scrape the website for your scraping pleasure.
import time
import requests
import os

import numpy as np
import pandas as pd
import seaborn as sns
import matplotlib.pyplot as plt

# for scraping javascript rendered webpages
from selenium import webdriver
from selenium.webdriver.common.keys import Keys
from bs4 import BeautifulSoup as bs

%matplotlib inline
sns.set_style('whitegrid')
plt.rcParams.update({'font.size':18})
page, records, results = 1, [], True
# initialize headless Chrome browser
driver = webdriver.Chrome(executable_path=os.path.abspath('')+'/chromedriver')
# initialize url
base_url = 'https://www.airbnb.com/d/talent?function=&location=&uuid=&relocation=&remote=&page='

while results:
    # get page
    url = base_url + str(page)
    driver.switch_to.window(driver.window_handles[page-1])
    driver.get(url)
    time.sleep(1)

    # parse as HTML
    page_html = driver.page_source
    bsoup = bs(page_html, 'html.parser')

    # find nested tag
    results = bsoup.find_all('div', attrs={'class':'_1jgihvq'})

    if results:
        # get values
        for res in results:
            name = res.contents[0].find('div', attrs={'class':'_1u6gy0cm'}).text
            title, _, dept = res.contents[1].text.partition('\xa0') # job title, department
            location, _, pref = res.contents[2].text.partition('\xa0') # location, preferences
            remote = True if 'remote' in pref else False
            relocation = True if 'relocation' in pref else False
            records.append((name, title, dept.strip('()'), location, remote, relocation))

    page += 1
    driver.execute_script("window.open('');")

driver.quit() # close Chrome window
Workflow:
-
Get page & parse as HTML: AirBnB’s talent pool website is rendered by JavaScript (JS) rather than HTML. Normally one can just use BeautifulSoup (BS) to parse data that readily exists in the website’s page source, but content in a JS website are not rendered in the source code, so a JS rendering engine is needed to render the page first before BS can parse it. So first I use selenium – a headless browser (i.e. browser without a GUI) – to render the JS website (with time delays), then parse it as HTML with BeautifulSoup.
-
Find nested tag: Once the page is read as HTML, then I use BS to inspect the content and find the information I want. This 4-part tutorial from Data School gives a quick and very useful overview on how to do this. In short, I find the nested tag at a level that contains all the information of an individual, then I use BS’s
find_allmethod to select the person’s information. -
Get values: Once I have each person’s profile, I use specific attributes to parse the features (e.g. name, localtion, etc) I want and store them as a list of tuples.
# make dataframe
df = pd.DataFrame(records,
                  columns=['name', 'title', 'dept',
                           'location', 'remote', 'relocation'])
print(f"Total profiles: {df.shape[0]}")
df.head()
Total profiles: 751
| name | title | dept | location | remote | relocation | |
|---|---|---|---|---|---|---|
| 0 | Long Bai | Performance Marketing Specialist | Marketing | Beijing | True | False |
| 1 | Alejandro Ozerkovsky | Product Manager, Design Language System | Product Management | San Francisco | True | False |
| 2 | Sarah (Goodie) Goodnow | Global Marketing Lead | Marketing | San Francisco | True | True |
| 3 | Ray Fu | Creative Producer | Production | Shanghai | True | False |
| 4 | Noor Loic Bin Satar | Pilot Perfect Scale Specialist | Other | Singapore | False | False |
_, ax = plt.subplots(1,1,figsize=(10, 10))
dept = (df.dept.value_counts()
               .to_frame()
               .transform(lambda x: x/x.sum()*100)
               .reset_index()
               .rename(columns={'dept':'pct', 'index':'name'}))
g = sns.barplot(y=dept.name, x=dept.pct, orient='h', palette='rainbow');
g.set(xlabel='Percent of total (%)', ylabel='Department',
      title='AirBnB layoffs by department');

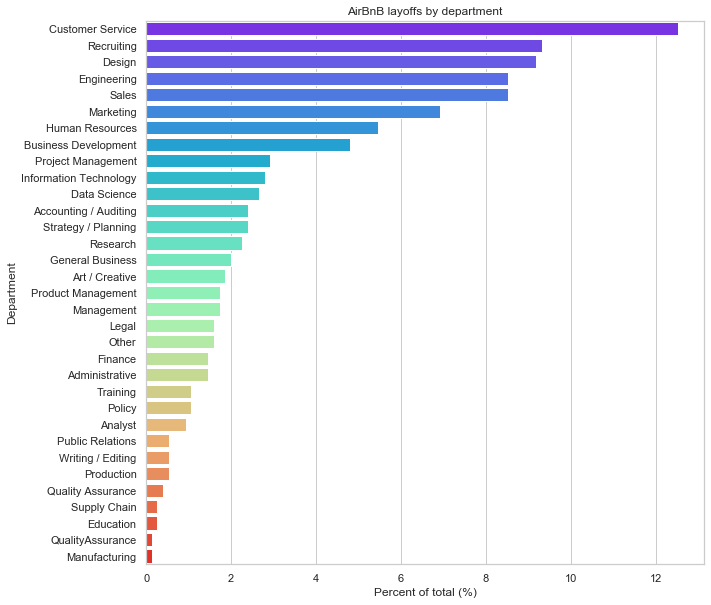
Note: This is not an indicator of how dispensible one department is compare to another, since we don’t know how many total employees are in each department. It could very well be that customer service, engineering, design, sales and recruiting comprise the majority of the company’s workforce, so that’s why there is a high percentage of people in those departments being laid off.
_, ax = plt.subplots(1,1,figsize=(10, 10))
location = (df.location.value_counts()
               .to_frame()
               .transform(lambda x: x/x.sum()*100)
               .reset_index()
               .rename(columns={'location':'pct', 'index':'city'}))
g = sns.barplot(y=location.city, x=location.pct, orient='h', palette='rainbow');
g.set(xlabel='Percent of total (%)', ylabel='City',
      title='AirBnB layoffs by city');

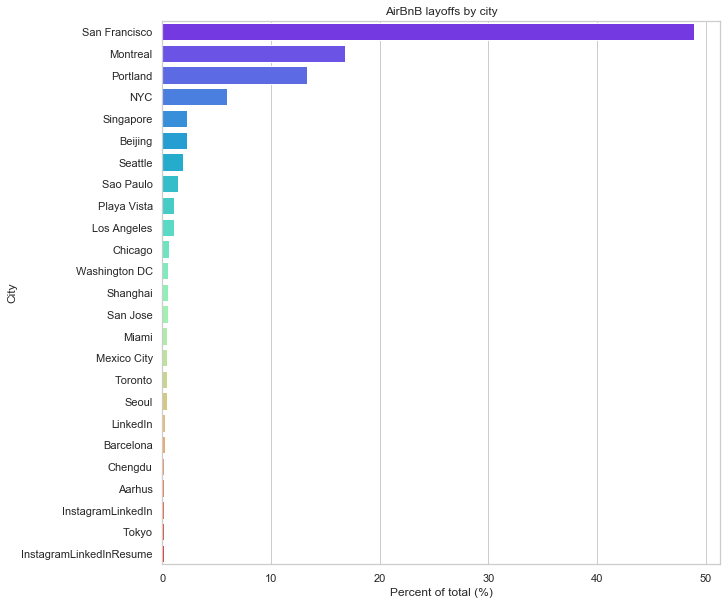
Around 50% of the total layoffs are from SF, which makes sense considering it is the AirBnB headquarter. More surprising are Montreal and Portland, which I guess probably have a large AirBnB campus.
# df.assign(pct = lambda x: x./x.sum()*100)
_, axs = plt.subplots(1, 2, figsize=(15, 4))
g1 = df.remote.value_counts().transform(lambda x: x/x.sum()*100).plot(kind='barh', ax=axs[0]);
g2 = df.relocation.value_counts().transform(lambda x: x/x.sum()*100).plot(kind='barh', ax=axs[1]);
g1.set(xlabel='Percent of total (%)',
       ylabel='Remote OK?',
       title='Will to work remote')
g2.set(xlabel='Percent of total (%)',
       ylabel='Relocation OK?',
       title='Willing to relocate');

Almost 80% are fine with remote work, but only around 45% are fine with relocation. Seems like tech workers are more than ready for a normalized remote work culture, but do tech companies feel the same way? It seems that major tech companies are ready for such changes.
Conclusion
This was part of my Funemployment 20% Project series to learn how to scrape data from dynamic JS-rendered websites, and also to learn about the ongoing layoffs at major tech companies. In the future I’ll do more of these when I come across other new and interesting datasets.
References