🧰 Progress-Enhance Project Tracker
I’ve been experimenting with a simple and flexible way to track the progression of my personal projects. Let’s call it the “Progress-Enhance” (PE) framework. Here’s how it works.
In the horizontal axis you lay out all tasks in their logical progression in a 2D plane, and the stage each task is in is represented by 2 colors: yellow for “todo” and green for “done.” There are no in-between colors, meaning each task should be scoped down small enough to be completed in one sitting.
X-axis orders milestones or features in their logical progression (i.e. A must be done before B, etc), and y-axis lists enhancements to be done to achieve the milestone.
As each task is completed, the box would go from yellow to green. The project can be considered complete when all boxes are green, and when no further enhancements need to be made.
That’s it!
To better illustrate this, here’s an example. I’m working on a data scraping project now, and the PE board looks like this,
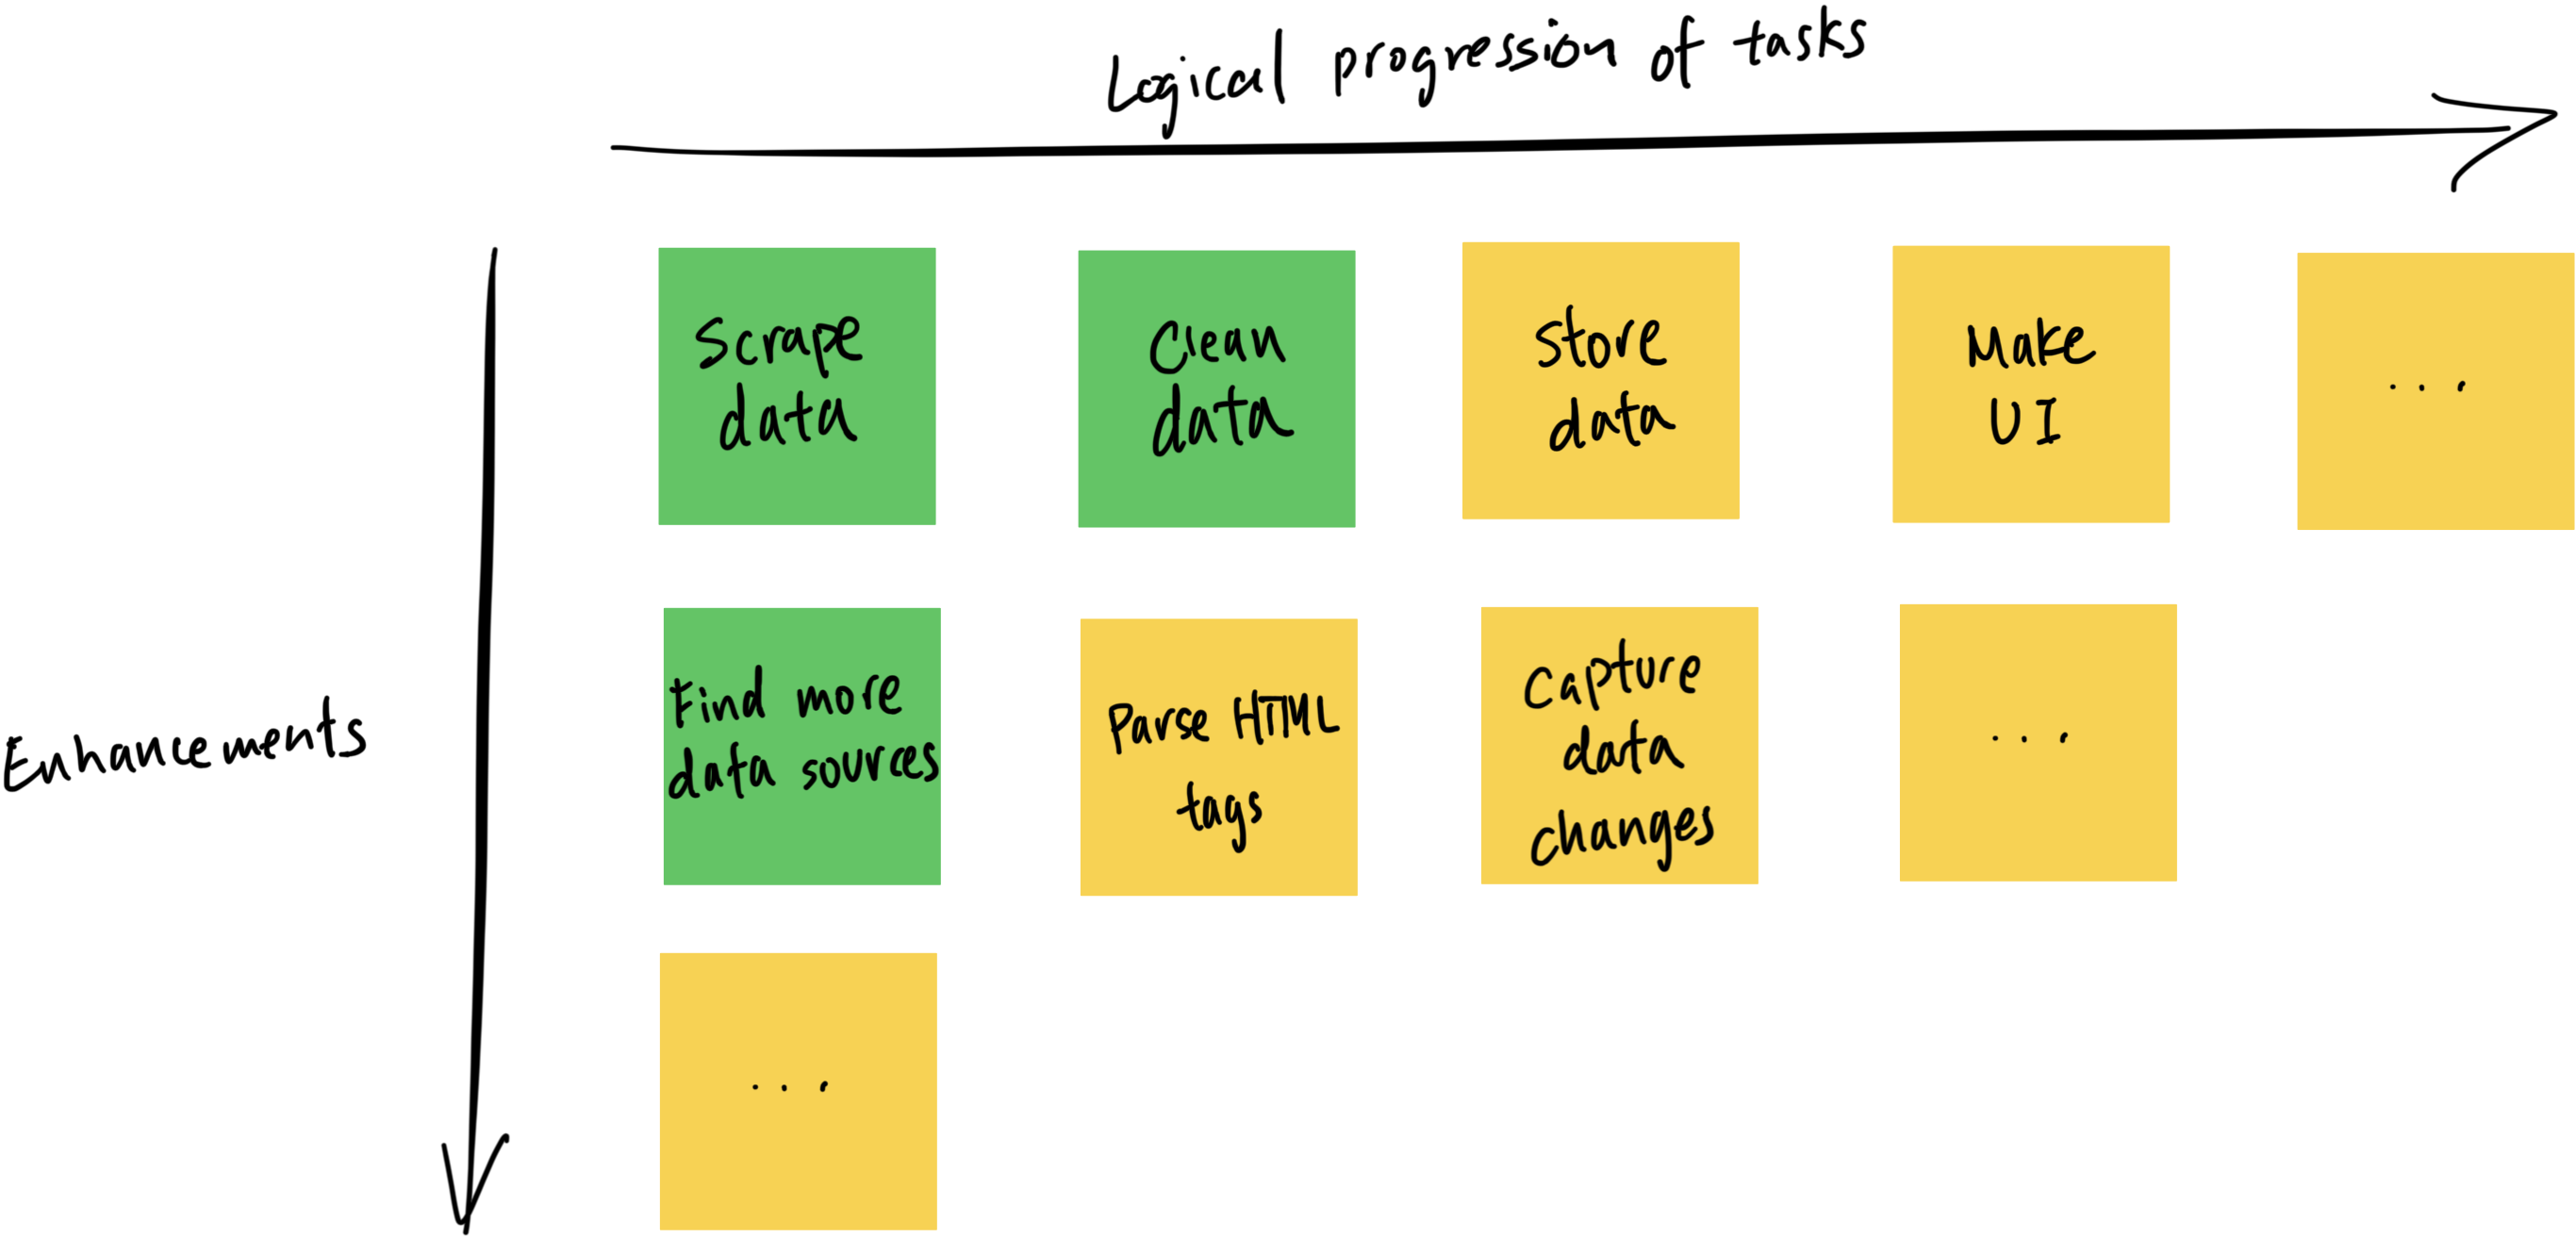
The project’s logical progression requires scraping the data, cleaning it, storing it, and creating a UI to make the data searchable, etc. Each step is logical ordered horizontally at the top. After the first pass through the project, I evolve the data scraping task by finding more data sources to enrich the dataset, and performe more detailed data cleaning by parsing HTML tags. The enhancements would continue for subsequent tasks, etc.
PE framework can be considered a derivative of the agile methodology — with the hierarchy of epics, stories, tasks, and Kanban board. But rather than listing and nesting the tasks in individual tickets (like in a story), or bucketing tasks into stages (like in Kanban), all tasks are presented visually in one board, and tracked with simple color schemes.
It’s low-tech and low-effort, and it’s been working well so far!